Resource Management Page Overview
Page Overview: The resource management page is the core interface in the visual management console for unified monitoring and configuration of quantum chips and computing clusters. This page centrally displays the operational status, basic configuration, and scheduling of all computing resources, and provides intuitive interactive operation entries.
Administrators can view the online status and load information of various resources in real-time on this page, and also support adding, editing, and deleting chip resources through the graphical interface, achieving dynamic access and flexible management of computing resources.
The page contains two main tabs—Chip Management and Cluster Management. When entering the resource management page, the Chip Management Tab is displayed by default, focusing on the status and control of quantum chips.
Chip Management
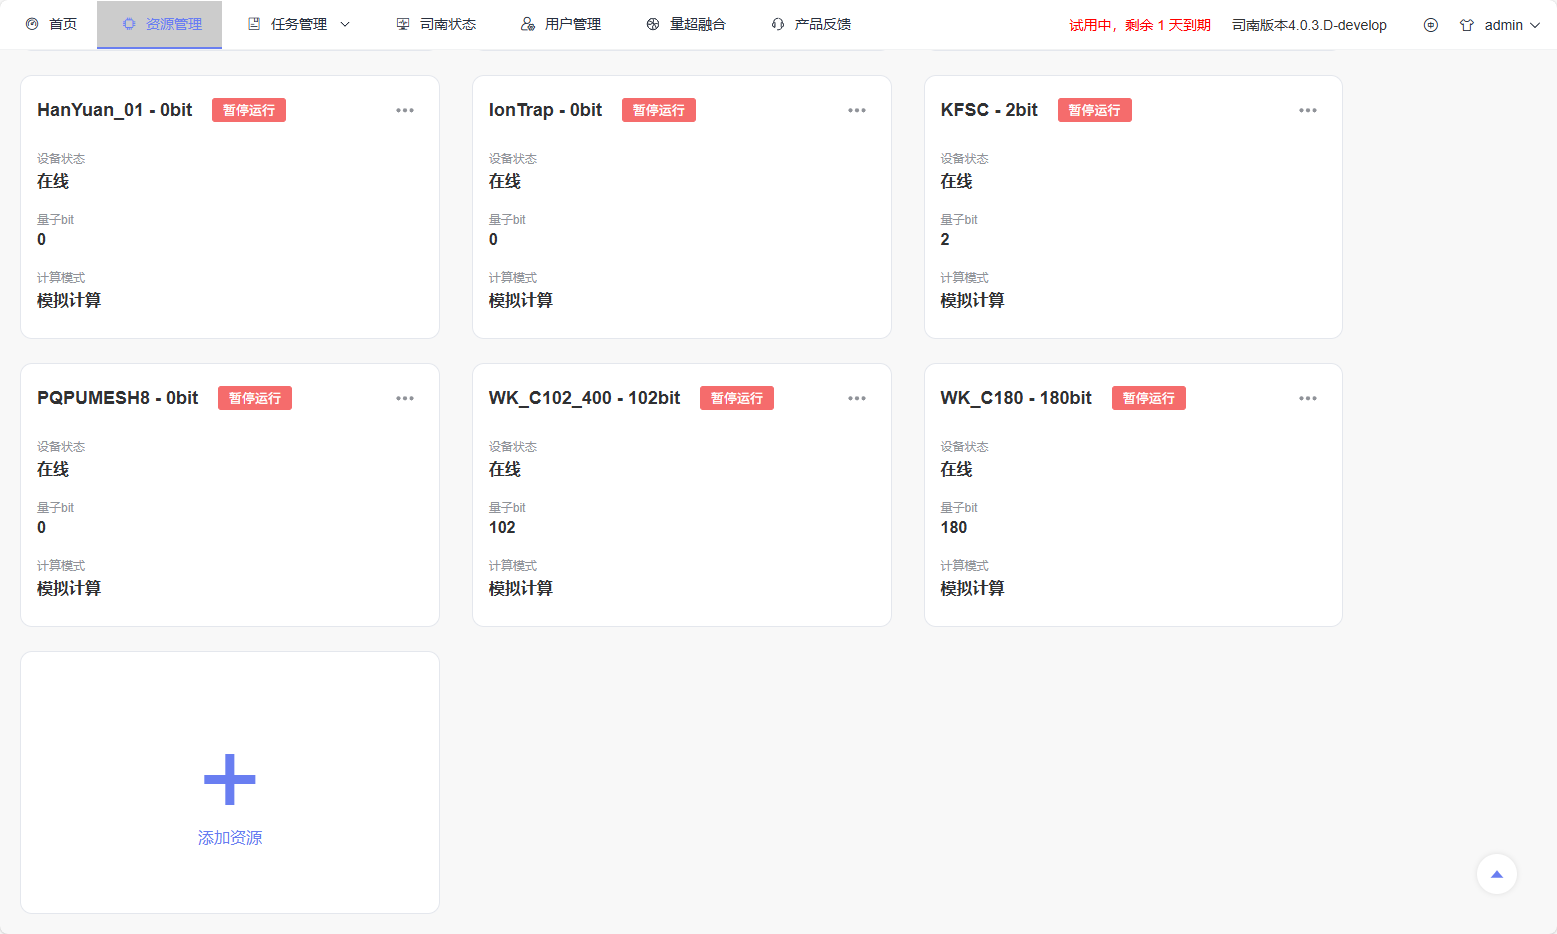
Function Description: The chip management module provides a comprehensive overview of all quantum chips currently registered in the PilotOS system. Each chip card displays real-time operational metrics and allows administrators to control scheduling operations directly on the interface. In addition to system auto-registered chip resources, this module also supports users manually adding custom chip resources. Users can enter basic chip information through the “Add Resource” entry to achieve rapid access of new computing resources; It also supports editing and deleting existing chip resources. As shown in the figure, each chip is displayed as an independent card, showing key information such as chip name, configuration, and current operational status, with edit and delete operation entries provided in the upper right corner of the card.
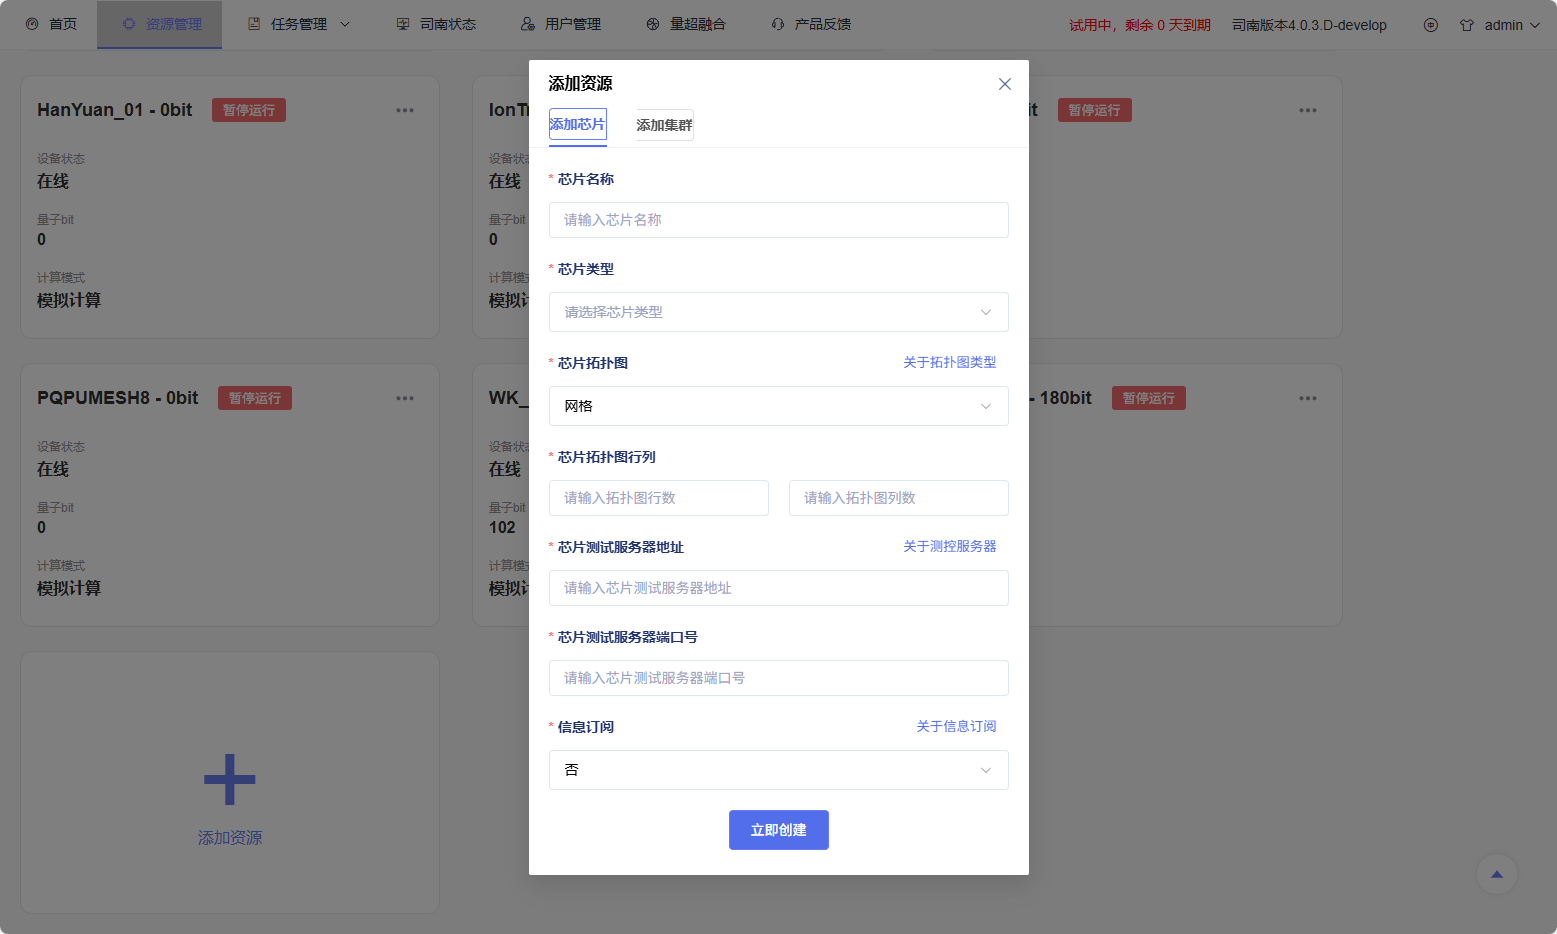
After clicking the “Add Resource” button, a chip resource creation form will pop up. Users fill in necessary information such as chip name and chip type according to the page prompts, and can complete resource registration after submission.
Operation Methods:
Click a chip card to open the detailed information drawer and view extended configuration and performance data.
Click the Pause Running or Resume Running button on the chip card to control task scheduling.
Click the Add Resource button at the top of the page, fill in chip information according to the form prompts, and submit to complete new resource access.
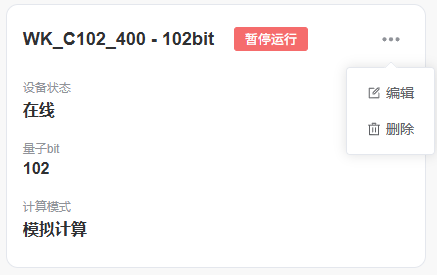
Modify existing chip resource configuration through the Edit button in the upper right corner of the chip card.
Remove unused chip resources through the Delete button in the upper right corner of the chip card.
Chip Detail Module
Function Description: The chip detail module provides a comprehensive interface for viewing, analyzing, and managing quantum chip configuration and operational data. After users click a chip card, a detail drawer will slide out on the right side, containing two functional tabs: Information and Configuration.
Information Tab
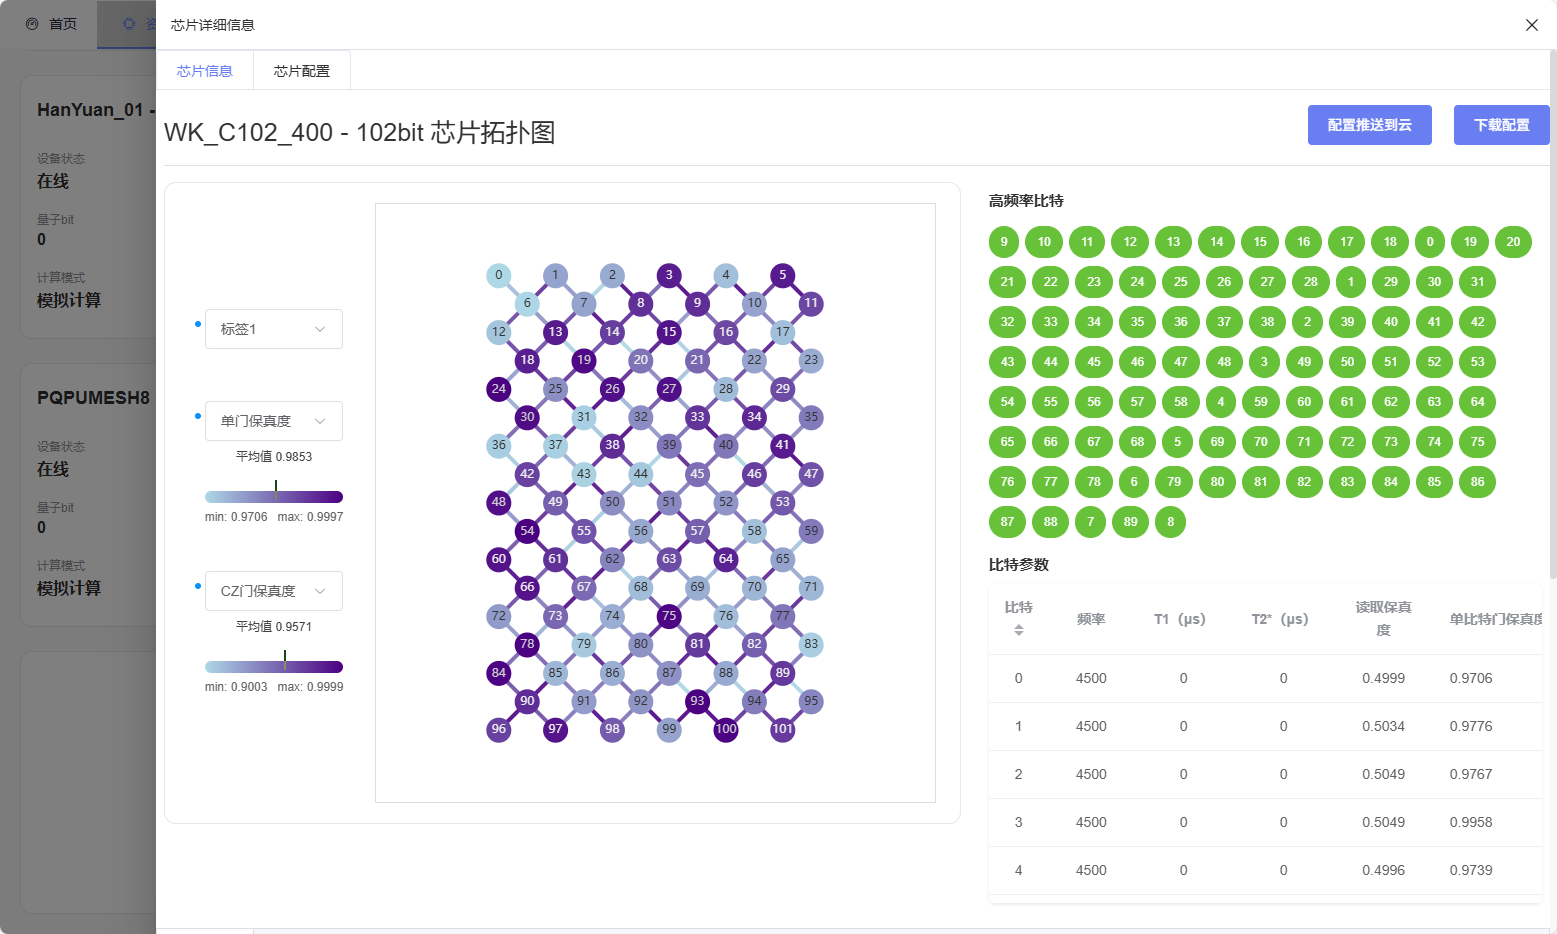
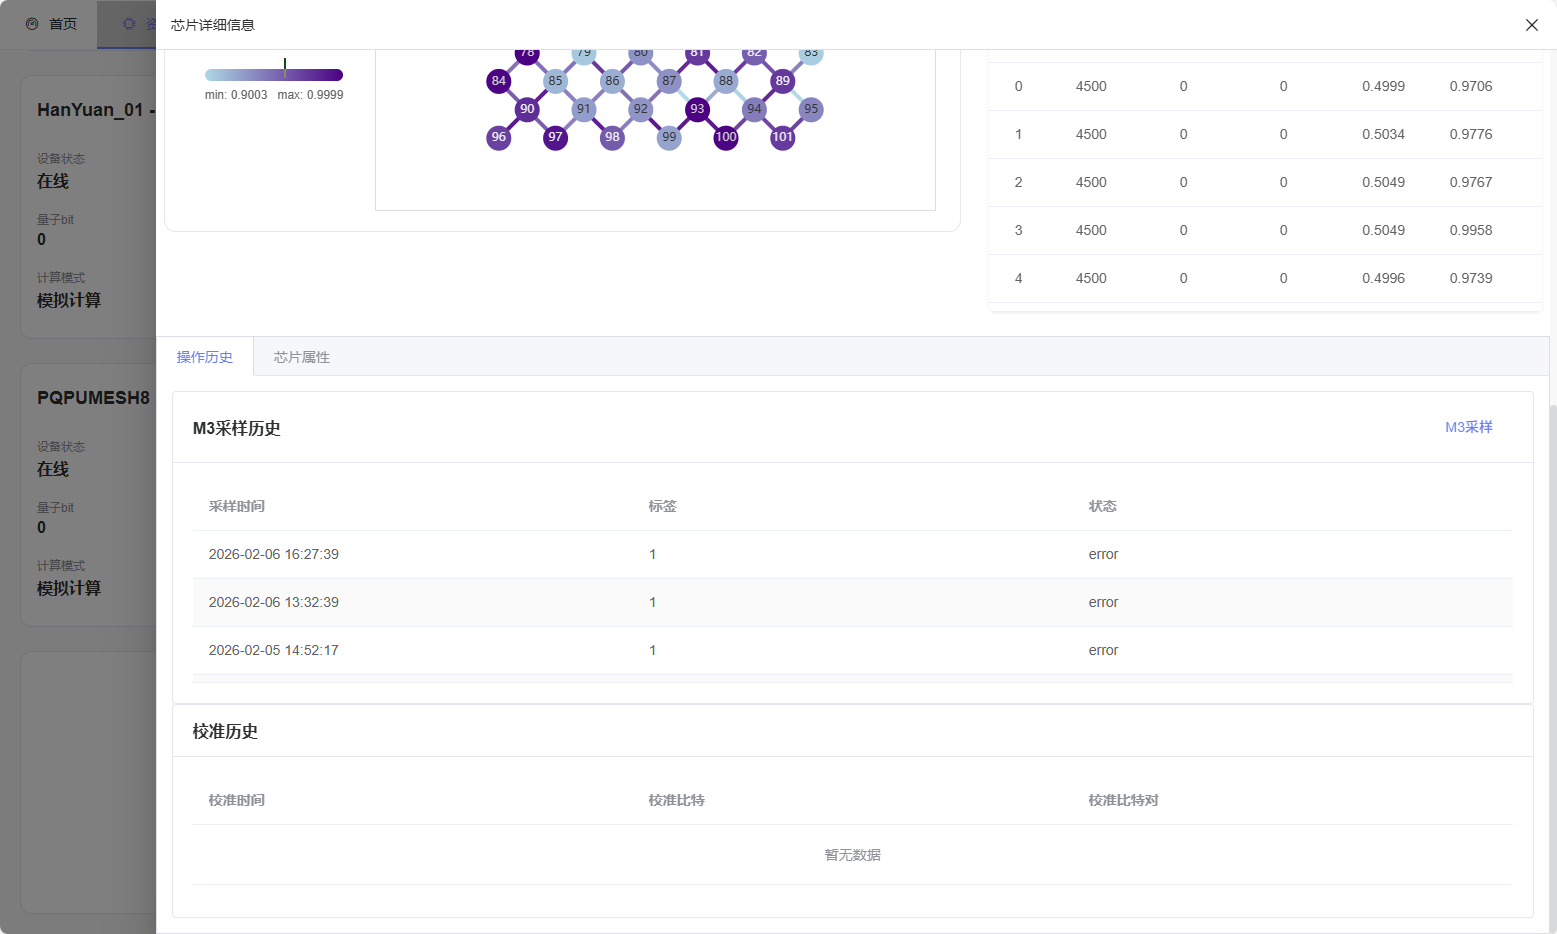
This tab is the main visualization interface for quantum chip topology, qubit parameters, calibration history, and system configuration.
Top Area: Displays chip name, number of qubits, and topology type, and provides: - Push Configuration to Cloud – Manually synchronize configuration data to the cloud. - Download Configuration – Export current chip configuration.
Left Panel – Topology View: Interactive topology diagram showing qubits and connections. Supports hovering or clicking to view data; clicking a qubit automatically locates the corresponding entry in the parameter table.
Right Panel – Qubit Parameter Table: Lists frequency, $T_1$, $T_2^*$, readout fidelity, and single-qubit gate fidelity, with high-frequency qubits automatically marked.
Bottom Tabs: Contains two sub-tabs: - Operation History: Displays M3 sampling and calibration logs, with ability to manually trigger sampling. - Chip Properties: Shows logic gate timing, noise models, and system metadata.
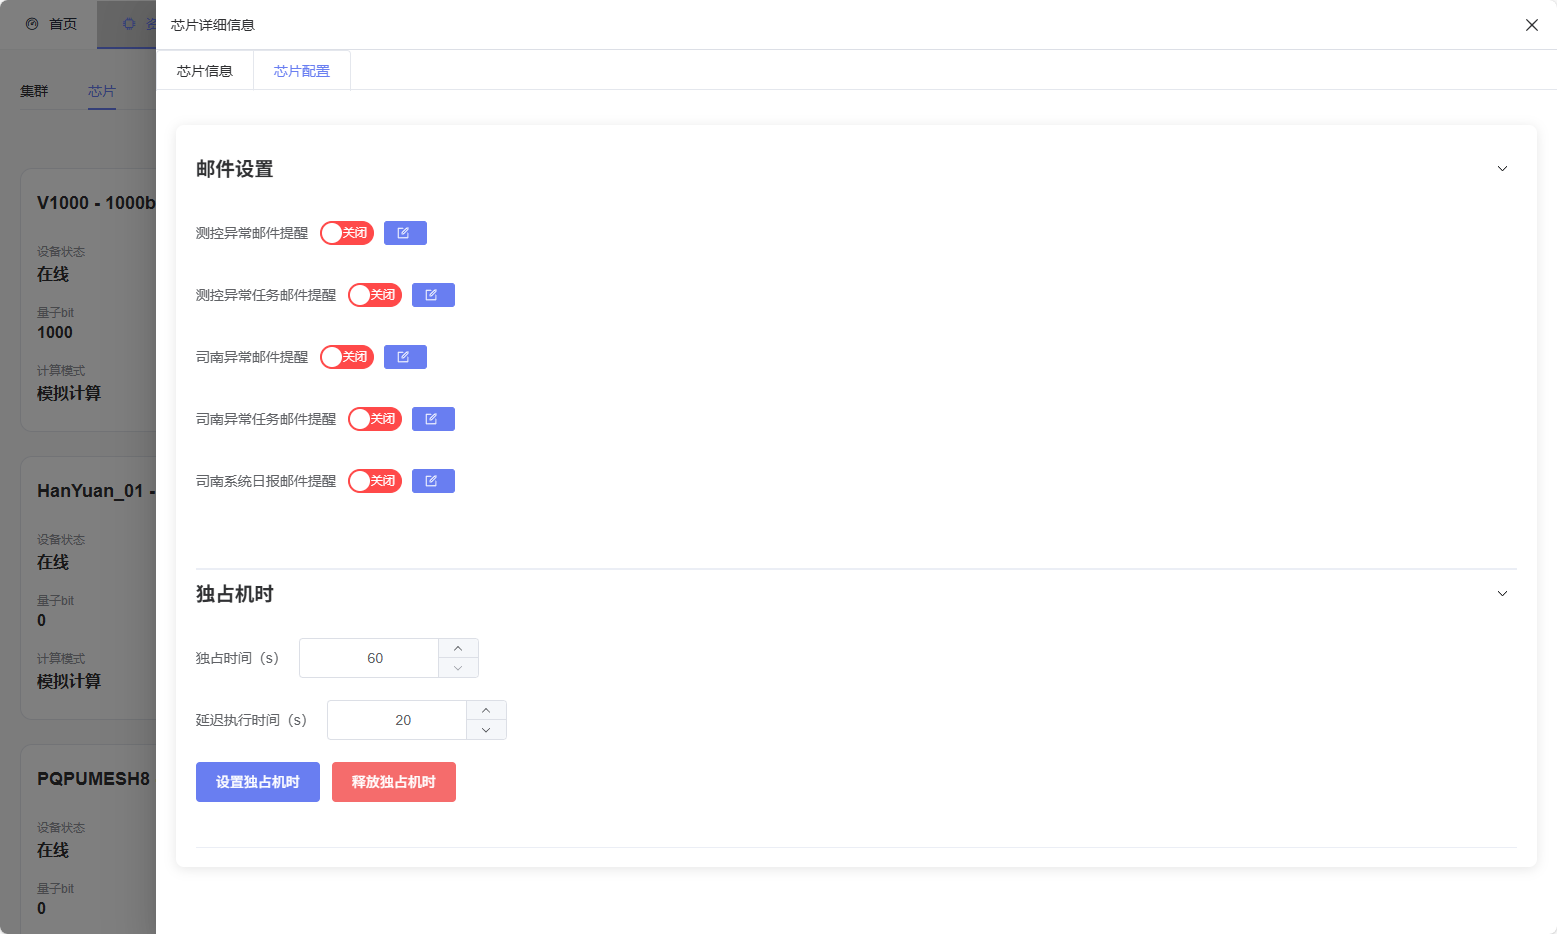
Configuration Tab
Accessible only by administrators, used for advanced configuration and scheduling management. Configurable Options:
Chip event notification settings (scheduled email reminders)
Exclusive time slot management
Cluster Management and Detail Module
Function Overview: The cluster management and detail module provides a unified interface for monitoring and managing all computing clusters connected to PilotOS. Users can view cluster overview, configuration data, node information, and task queue status in a single integrated view.
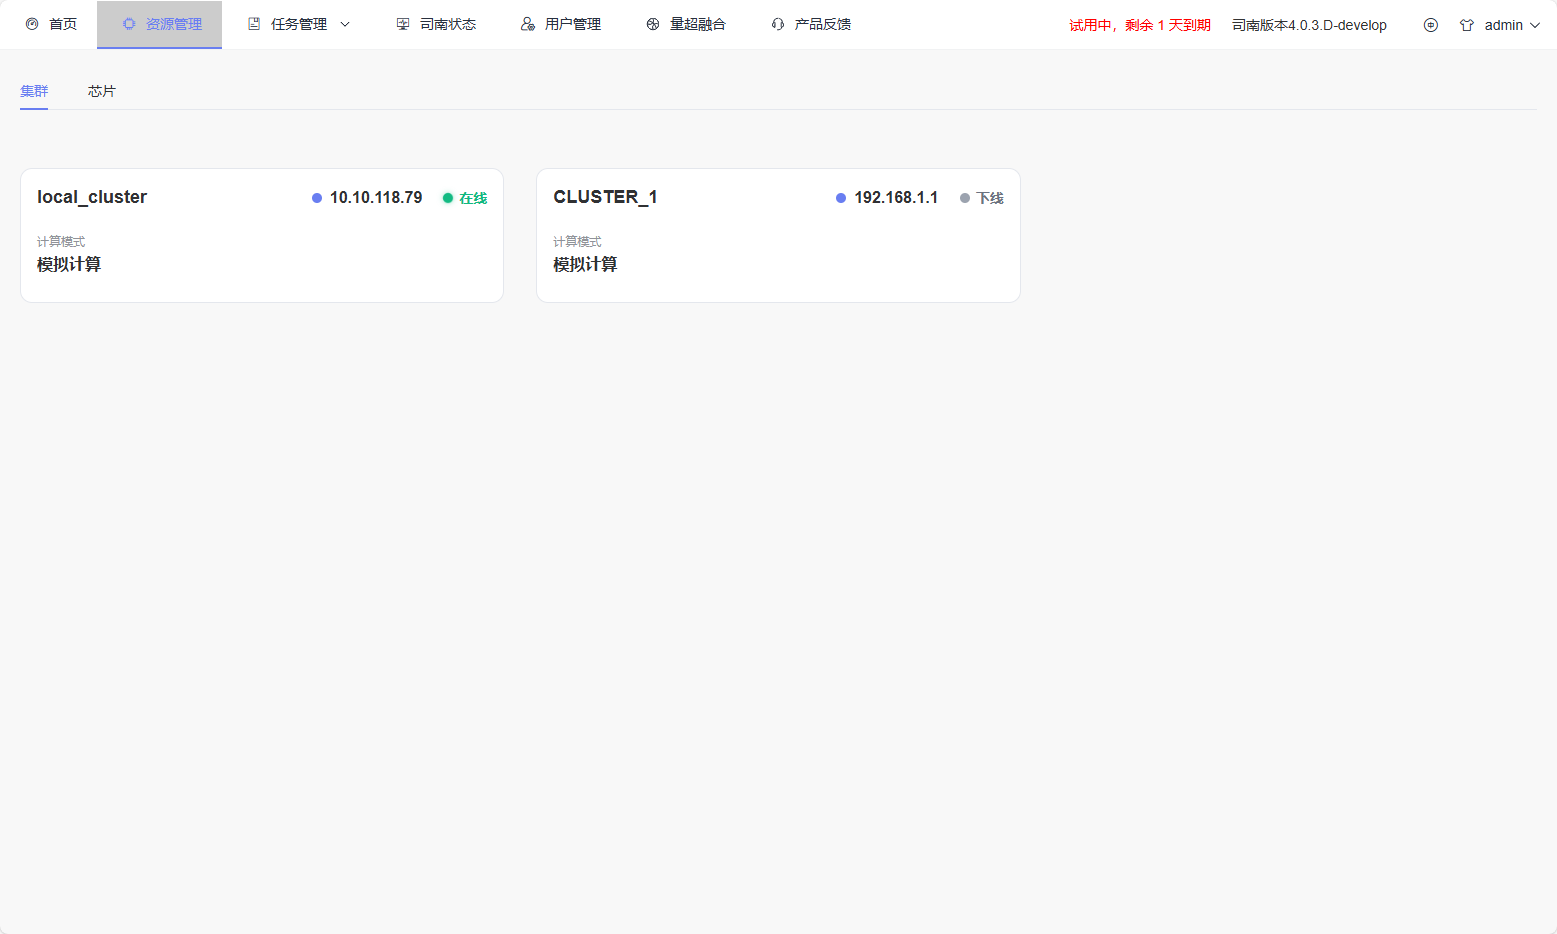
Cluster Management As shown in the figure, each cluster is displayed as a card showing its summary information, including:
Cluster Name and Status: The top left displays the cluster name, and the right side displays the master node IP address (if available).
Scheduling Status: Online / Offline.
Computing Mode: Physical or simulation.
Cluster Detail Module: After clicking a cluster card, a detail drawer will slide out on the right side, providing an in-depth view of real-time cluster performance and resource scheduling.
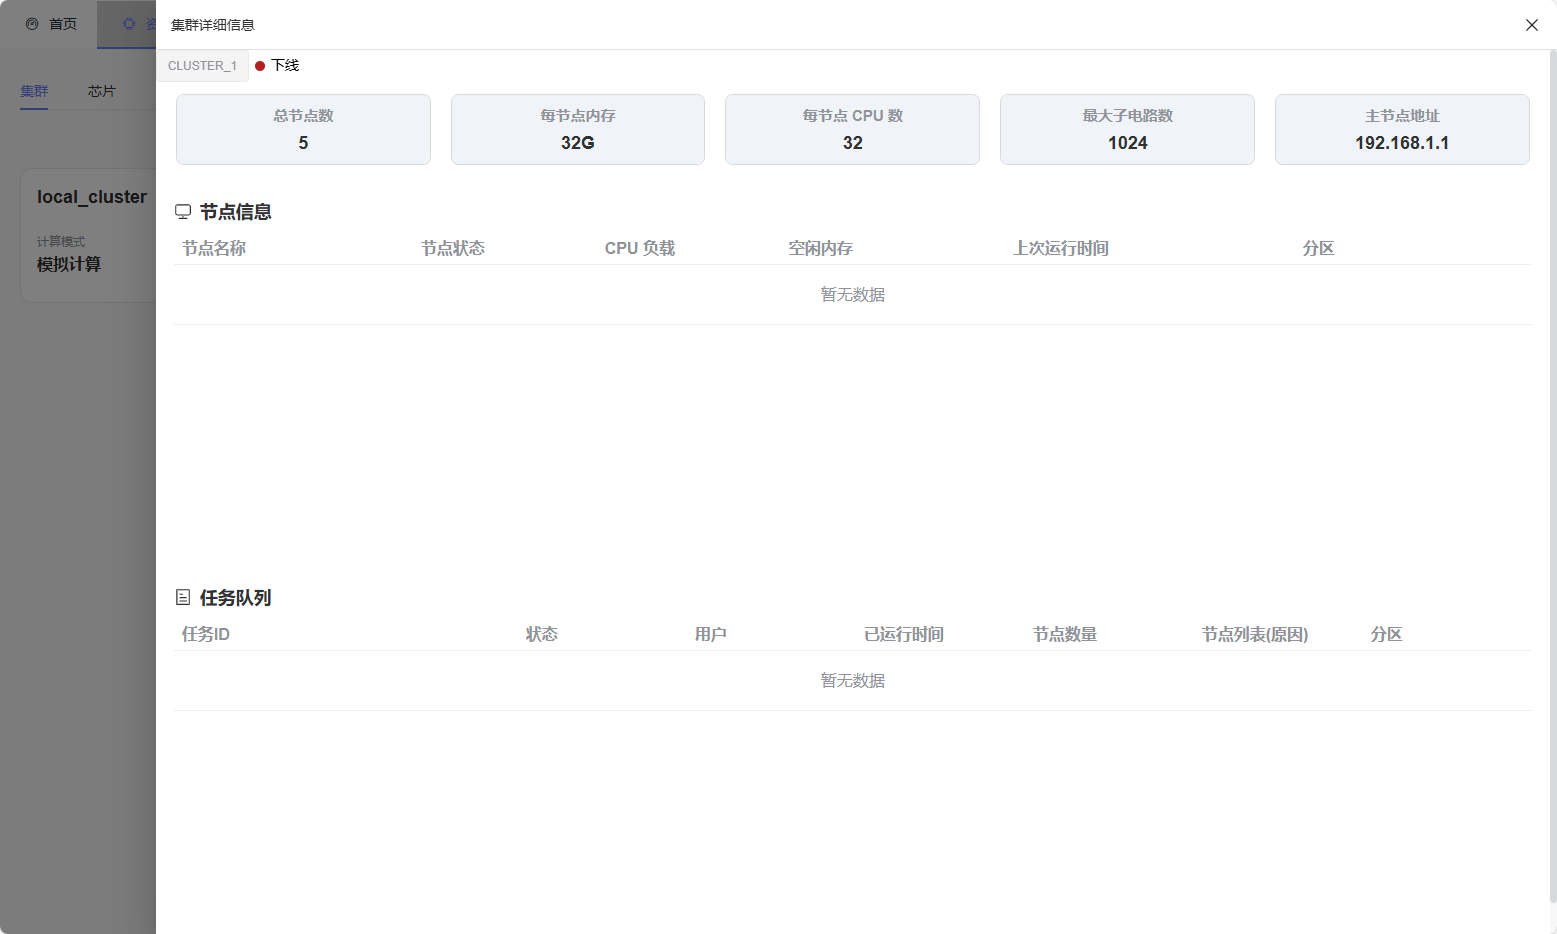
As shown in the figure, this module contains:
Configuration Summary: Displays key hardware metrics, including total number of nodes, memory per node, number of CPUs per node, maximum number of sub-circuits, and master node address.
Node Information Table: Lists each node’s status (running or idle), CPU load, available memory, last run time, and partition allocation.
Task Queue Table: Provides real-time task data, including task name, status, user, run time, assigned nodes, and partition.
Operation Guide:
Check node load and memory usage through the node information table.
Monitor the task queue to obtain run time and scheduling information.