
Circuit Visualization
API reference for circuit drawing, statistics, and summary functions. Provides text, image, and LaTeX output for quantum circuits, as well as gate/layer distribution analysis.
circuit_summary
Generates a statistical summary of a quantum circuit, including gate counts and layer counts by category.
Signature
circuit_summary(prog, show: bool = True) -> CircuitSummaryParameters
| Parameter | Type | Description |
|---|---|---|
| prog | QProg or QCircuit | The quantum circuit to analyze |
| show | bool | Whether to immediately display the pie chart visualization (default True) |
Returns
CircuitSummary -- an object holding circuit statistics and visualization methods.
Examples
from pyqpanda3 import core as pq
from pyqpanda3.visualization import circuit_summary

q = pq.Qubit(0)
prog = pq.QProg()
prog << pq.H(q) << pq.CNOT(q, pq.Qubit(1))

summary = circuit_summary(prog, show=False)
print(summary)
print(f"Total gates: {summary.info.node_num}")
print(f"Total layers: {summary.info.layer_num}")
Output:
ProgInfo(single_gate_num=1, double_gate_num=1, multi_control_gate_num=0, node_num=2, single_gate_layer_num=1, double_gate_layer_num=1, layer_num=2)
Total gates: 2
Total layers: 2
CircuitSummary
Container for circuit statistics returned by circuit_summary. Holds a ProgInfo dataclass and provides display methods.
Signature
class CircuitSummaryAttributes
| Attribute | Type | Description |
|---|---|---|
| info | ProgInfo | Dataclass containing gate and layer statistics |
ProgInfo fields
| Field | Type | Description |
|---|---|---|
| single_gate_num | int | Number of single-qubit gates |
| double_gate_num | int | Number of two-qubit gates |
| multi_control_gate_num | int | Number of multi-control gates |
| node_num | int | Total number of gate nodes |
| single_gate_layer_num | int | Number of single-gate layers |
| double_gate_layer_num | int | Number of double-gate layers |
| layer_num | int | Total number of layers |
Methods
show()
Displays a pie chart with gate and layer distribution.
summary.show()__str__()
Returns a string representation of the ProgInfo dataclass, showing gate and layer counts by category.
print(summary)show_prog_info_count
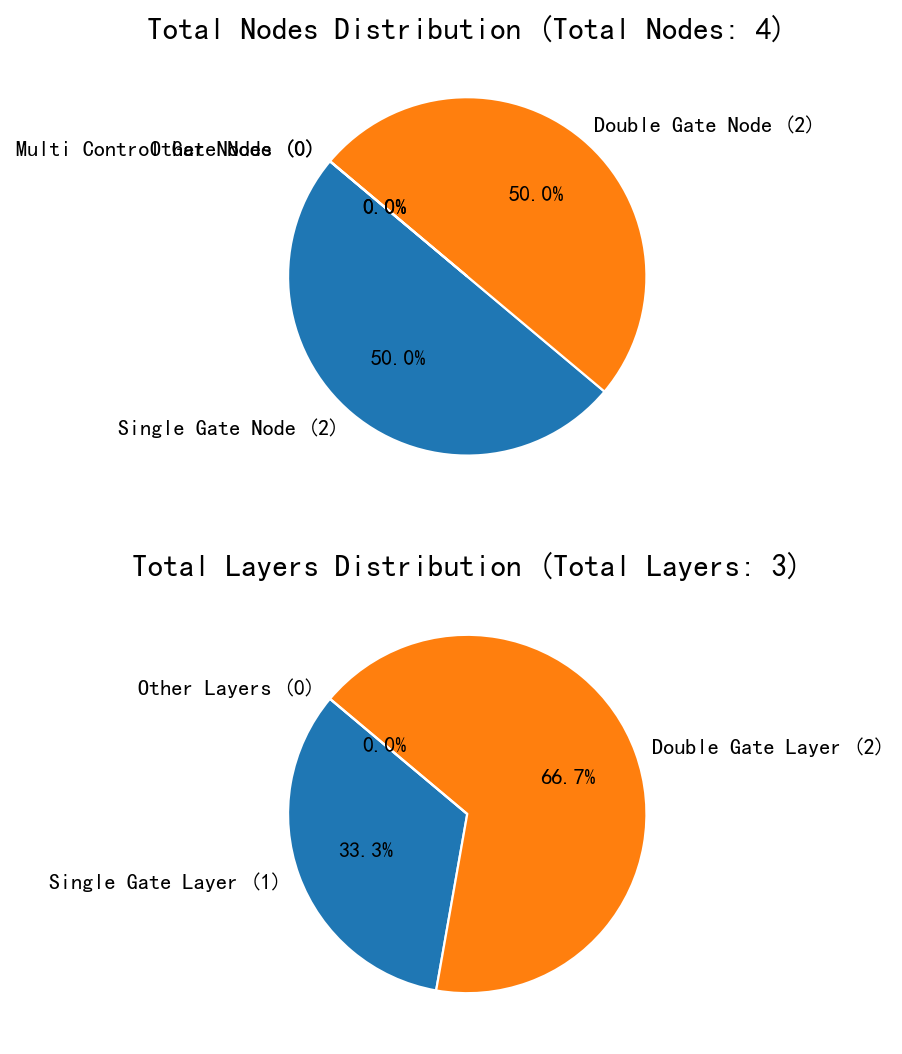
Displays pie charts showing the distribution of gate nodes and layers in a quantum circuit.
Signature
show_prog_info_count(prog) -> NoneParameters
| Parameter | Type | Description |
|---|---|---|
| prog | QProg or QCircuit | The quantum circuit to analyze |
Description
Renders two pie charts using matplotlib:
- Top chart -- node distribution: Single Gate Node, Double Gate Node, Multi Control Gate Node, Other Nodes
- Bottom chart -- layer distribution: Single Gate Layer, Double Gate Layer, Other Layers
Examples
from pyqpanda3 import core as pq
from pyqpanda3.visualization import show_prog_info_count

q = pq.Qubit(0)
prog = pq.QProg()
prog << pq.H(q) << pq.CNOT(q, pq.Qubit(1))

show_prog_info_count(prog)
Output:
Displays two pie charts: the top chart shows node distribution (Single Gate Node, Double Gate Node, Multi Control Gate Node, Other Nodes), and the bottom chart shows layer distribution (Single Gate Layer, Double Gate Layer, Other Layers).
draw (QProg / QCircuit method)
Draws a quantum circuit in text, image, or LaTeX format. Injected onto QProg and QCircuit at import time.
Signature
prog.draw(output='text', filename=None, scale=0.7, fold=30,
          with_logo=False, with_gate_params=False, line_length=100,
          NodeIter_first=None, NodeIter_second=None,
          console_encode_type='utf8') -> str | None
Parameters
| Parameter | Type | Default | Description |
|---|---|---|---|
| output | str | 'text' | Output format: 'text' (ASCII), 'pic' (matplotlib image), or 'latex' |
| filename | str or None | None | Output file path. For 'pic' defaults to QCircuit_pic.jpg. For 'latex' defaults to QCircuit_latex.tex. For 'text', if specified, saves text to file |
| scale | float | 0.7 | Image scale factor (only for 'pic' output) |
| fold | int | 30 | Maximum width of image in gate units (only for 'pic' output) |
| with_logo | bool | False | Whether to include a logo (only for 'latex' output) |
| with_gate_params | bool | False | Whether to display gate parameters |
| line_length | int | 100 | Line length for 'text' output |
| NodeIter_first | iterator or None | None | Circuit start position for partial drawing |
| NodeIter_second | iterator or None | None | Circuit end position for partial drawing |
| console_encode_type | str | 'utf8' | Console encoding type for 'text' output. Supported values: 'utf8', 'gbk' |
Returns
'text'and'latex'-- returnsstr'pic'-- returnsNone(image saved to file)
Examples
from pyqpanda3 import core as pq

q = pq.Qubit(0)
prog = pq.QProg()
prog << pq.H(q) << pq.CNOT(q, pq.Qubit(1))

# ASCII text output
text = prog.draw()
print(text)

# Save to image file
prog.draw('pic', filename='my_circuit.png')

# LaTeX source
latex = prog.draw('latex')
print(latex)

# Show gate parameters in text output
prog.draw('text', with_gate_params=True)
Text output (may vary slightly depending on console encoding):
          ┌─┐
q_0:  |0>─┤H├ ───*──
          └─┘ ┌──┬──┐
q_1:  |0>──── ┤CNOT├
              └──┴──┘
 c :   / ═══════════
LaTeX output:
\documentclass[border=2px]{standalone}
\usepackage[braket, qm]{qcircuit}
\usepackage{graphicx}
\begin{document}

\scalebox{1.0}{
\Qcircuit @C = 1.0em @R = 0.5em @!R { \\
\nghost{} & \lstick{\ket{q_0}} & \gate{\mathrm{H}} & \ctrl{1} & \rstick{}\qw & \nghost{} \\
\nghost{} & \lstick{\ket{q_1}} & \qw & \targ\qw & \rstick{}\qw & \nghost{} \\
}}
\end{document}
See Also
- Visualization Overview -- Full visualization module overview
- QGate -- Quantum gate API reference